To analyse the global impact of FM, we indicate individual attendance by using attention metadata indicating user browser hits and plot the geo-location of unique IPs on maps, showing in this way the participation in live events and the event replay reuse (Tomadaki, Scott and Quick, 2007). The IP logs can be used in a variety of ways to visualise for example live meeting attendance and replay reuse. IP addresses are registered to physical postal addresses, and these can therefore be plotted to a map. Usually, the registration address of an IP very closely matches that of the individual to which it has been issued, with some occasional discrepancies due to incorrect locations. As IP addresses are continually being registered, the database used to resolve IPs to geographical locations continually has to be updated and it is possible that a few IPs may not yet exist in the database and therefore not plotted.
A number of virtual communities use the meeting application. Attention metadata produced by live logs can indicate the individual attendance in one meeting, or show the attendance of individuals in a virtual community holding a set of meetings. For example, the 'video-blogging' community have attended 36 videoconferencing events in approximately 8 months. The event frequency in such a short period of time shows the engagement of a very active community, holding social events that tend to happen during weekdays or weekends and there is an upward trend showing more individuals engaged in the virtual community.
The public replay hits can show the reuse of the meeting by the people who attended the event and by other people who may have not attended the specific event or any live meeting. The Folksonomy includes all public meetings, based on the metadata produced by keywords added when booking or editing the meeting. It is possible to give insights into a learning object's impact, by taking into consideration the hits and unique IPs of users who paid attention to its resources. Several meeting replays can be considered as learning objects. For example, the series of 'LOMI' (Learning Objects, Metadata and Interoperability) seminars can be reused to learn about learning objects and metadata, while there are other series of events, seminars, lectures or presentations, with a goal to transfer knowledge.
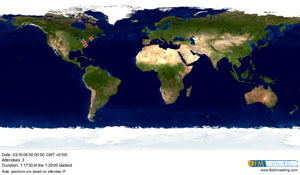
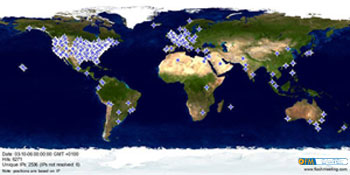
The most popular replays relate to a series of presentations called 'Historic Homeworks' showing a range of house renovation activities from window repairs to floor planing. From March 2006 until May 2007 there had been 36 of these events. The replays of 7 of these presentations had been each viewed more than 3,500 times and the replay of one of the presentations from October 2006 included the highest number of viewings, counting over 6,000 hits from over 2,500 unique IPs and resulting in an impressive reuse map, while in the live meeting there were only 3 attendees.
We explore possibilities of on-line meetings in the context of a formal learning initiative, and how replays of these meetings have been used as Learning Objects to improve the professional learning experience. We report on studies in professional learning in a formal context, investigating how a formal learning group have used FM and more specifically the Learning Objects generated. We aim to provide insights into improving the use of technology enhanced learning in different environments, not only inventing new ways to learn but also enhancing traditional ones.
For more For more information, please contact:
Linda Castañeda
Grupo de Investigación de Tecnología Educativa GITE
Departamento de Didáctica y Organización Escolar
University of Murcia
Homepage


